What’s in my JVM memory
“The Mendix Runtime executes the model created in the Modeler. It serves pages to the Client and executes microflows, calls web services, generates documents, communicates with the database and much more.”
The Mendix Runtime is a program written in Java and Scala, and it uses a Java Virtual Machine, or JVM. When running, it uses up some amount of system memory in your operating system.
What’s in my JVM memory?
Let’s have a look at a possible graph that shows the memory usage of the JVM:
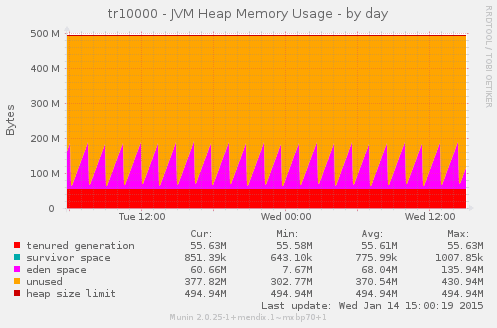
In this graph, we see an application that has 512 MB of Java Heap space. This is the memory space that is primarily used by the Mendix Application itself. If you do a retrieve object in a microflow, this is where the objects that are read from the database are kept in memory.
The Mendix Runtime also uses this space to store java objects for logged in sessions, intermediate objects that convert the raw data from the database to objects that can be used inside a microflow, or to objects which can be directly forwarded on the wire if it’s data that has to be shown in a datagrid in your web browser. Did you even know that even your microflows itself are objects in here? The Mendix Runtime is an interpreter, it also stores a copy of your modeled application in its memory.
Different parts of this memory space are managed by the JVM garbage collector. (also see the JVM Heap documentation)
The previous shown example is actually taken of an application that is not really being used at all, but probably has some scheduled event, which causes a bunch of objects to be created which can be garbage collected shortly after that.
The JVM is not alone…
Now, this Java memory also has to fit inside the system memory of the operating system itself. If you’re using the Mendix Cloud, you can view these graphs in the monitoring part of our deployment portal.
Here’s the graph that displays the actual use of operating system memory. It’s a so-called appnode, that is dedicated to running the application process of a single environment of a Mendix application (so, either a test, acceptance or production environment).
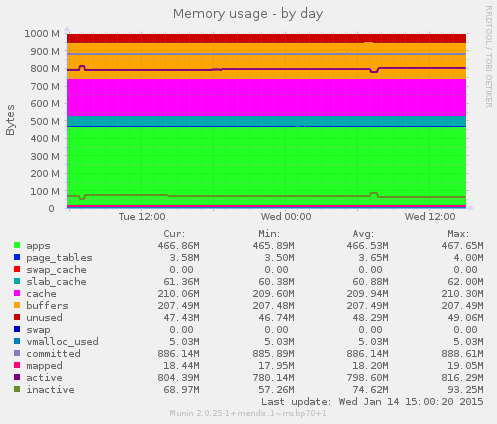
Looks quite right, doesn’t it? Around 500MB is in use, so that must be the Java Heap we’ve seen above. The database runs on another virtual machine, so the database usage is not visible here. Apparently Mendix provisioned a Linux virtual machine with 1024MB of memory to fit your Java process in.
Wait, what?
Now, let’s have a look at another example:
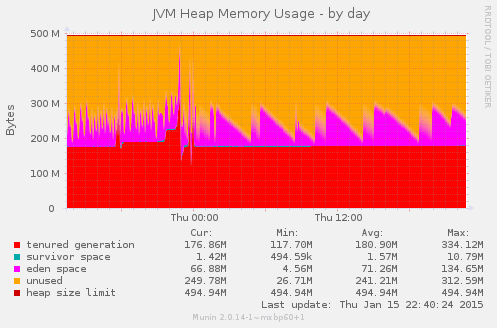
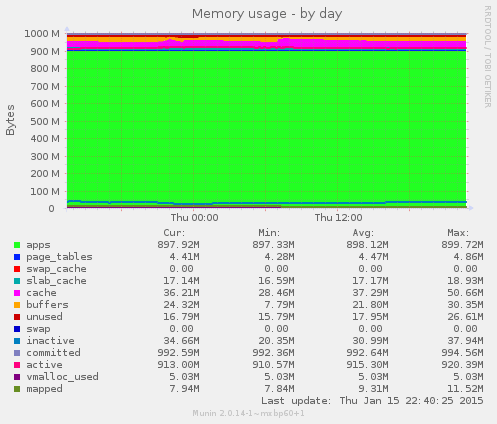
Wait a minute… Why is there more than 900MB of memory in use in the operating system instead of just the 512MB that it was supposed to use? Is Mendix secretly running some other processes alongside our application to make use of the otherwise unused memory?
No, that’s not the case. Really. 🙂 Well, ok… there are some extra processes that are always running besides the application itself, which are for example two monitoring agents, one to provide the trends system with data (to produce these graphs) and one who provides data to the alerting system. And, there’s a process that can stop and start your application when it gets a signal from the deployment portal when you press the stop or start buttons over there.
But all of those were also present in the first example shown. So, what’s going on here…?
Let’s have a look at the output of the ps command, which can display how much memory each process on a server takes up:
USER       PID %CPU %MEM    VSZ   RSS TTY      STAT START   TIME COMMAND
xxxxx    19137  1.8 84.7 1248796 864696 ?      Sl    2014 1177:33 java -Dfile.encoding=UTF-8 -XX:MaxPermSize=128M -Xmx512M -Xms512M -Djava.io.tmp...
Yes, it’s the java process that’s really using up 864696 kB of memory.
Why bother?
Why should we bother about this? After all, the process still fits inside the 1024MB of memory that is available, even if this 512MB java process somehow magically grows to 844MB.
Well, actually, this kind of behaviour causes a few problems, as it prevents other programs from running on the server, which are being started from time to time.
We do releases and security updates…
At Mendix, we regularly, and possibly way more often than you would suspect, roll out changes to our hosting platform. Weekly, or more usually, even a few times each week, small changes are made to our entire hosting platform. Instead of piling up new features and bug fixes into a huge monthly release, we roll them out as soon as they’re ready to go into production.
And they need to run!
For deploying changes to production, we primarily use puppet and Debian packages to update our software on application and database servers running customer projects. Besides that, there’s a program called unattended upgrades which is installing security updates on all servers whenever they are available.
So, this Java process growing out of all proportions can prevent any of these from happening. Not installing releases could mean that your application can get into compatibility problems with the rest of the deployment system. Missing out on security updates is something that nobody should want to happen.
Luckily, this problem is only popping up at a very limited number of environments (0.53% of all application environments, right now).
Linux kernel to the rescue!
The first step in the process of finding out what’s going on here, leading to a fix for this behaviour is to provide more insight into the situation.
If a Java process is configured to use 512MB Heap space… What does that mean at all? The Java Heap graph as presented above shows a part of memory that is being used to store actual objects that are used within java code. But, to run a java process… we need to start the java program itself. Does this program has to be present in memory also? Is it located inside this JVM Heap memory? And what about the gazillion jar files that we just put inside our userlib location of the project? What will happen to them?
To have a better understanding of this, it would be nice to have a graph that not only shows the Java Heap space, but one which shows the memory space that the entire Java process takes up in the operating system.
…by providing detailed memory usage information
Luckily, the Linux kernel allows us to retrieve a full overview of the memory address space that a single process is occupying, using the proc file system. The PID (program identifier) of the example java process that I showed previously is 19137. This means that I can issue the following command on a linux shell prompt to let the linux kernel show everything about the memory allocation of this process: cat /proc/19137/smaps
Using the smaps information that is available, it’s possible to make a quite accurate educated guess about what’s going on inside the JVM process.
Let me present you the new JVM Process Memory usage graph which belongs to the very first application graph showed on this page:
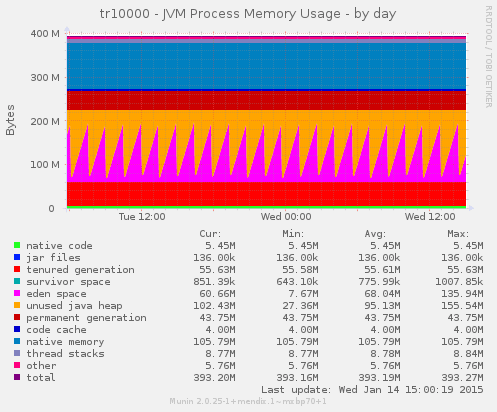
Aha! It was not a 512MB Java heap after all that occupied the memory! It was just about 230MB, and the other part seems to be occupied by memory that is allocated outside of the Java object heap. Part of it is the permanent generation and code cache, which stores objects that the JVM considers not being interesting enough to garbage collect, because it will never go away as long as the application is running. Another part is the native memory part.
Now let’s have a look at the graph belonging to the problematic application:
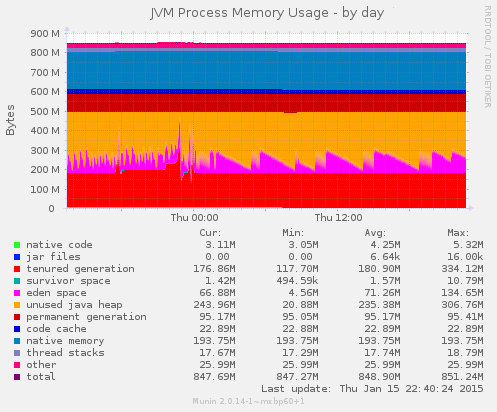
In this scenario, the Java Heap is actively used, so it has been really allocated by the operating system, instead of just being promised that it could be available for use when actually needed.
The main takeaway here is that we were being fooled into thinking that the actual operating system memory was fully ocuupied by the JVM Object Heap while it was not the case.
When it’s really getting out of hand…
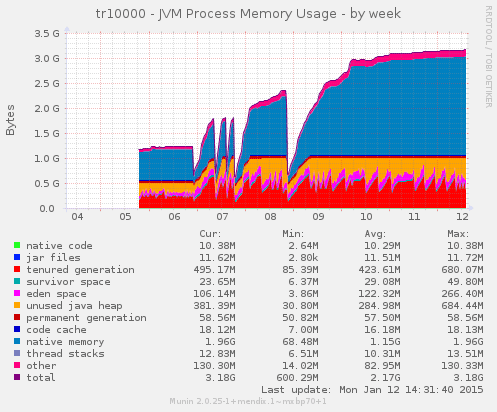
To conclude this blog post, here’s an example of a situation that really crosses all boundaries of sane behaviour.
Here we have a 1024MB Java Heap configuration, which was upgraded from a 512MB Java Object Heap to a 1GB Object Heap:
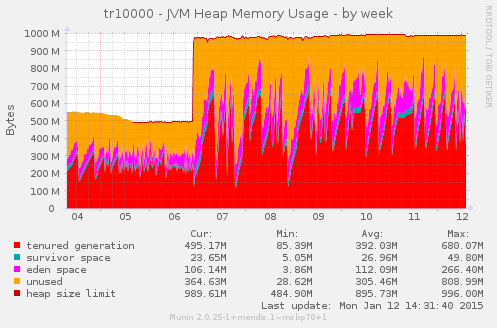
Unfortunately, the memory usage of the JVM process exploded, and we had to resize the operating system to cope with that:
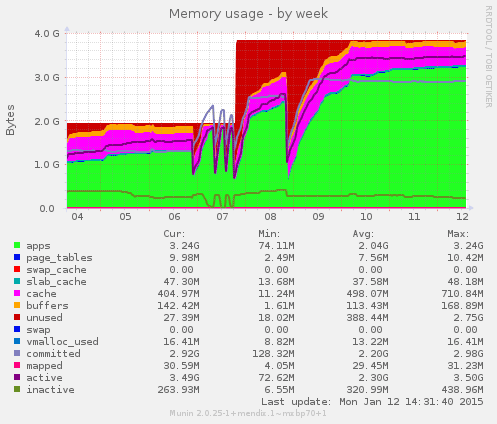
The new JVM Process Memory graph shows what’s going on here:
To be continued…
Research that has been done on this in the previous weeks already shows a number of possible remedies for the growing out-of-heap-memory issues. In a future blog post, I’ll elaborate on those. Customer applications that are running into the forementioned release and security update problems can expect a call from Mendix about how we’re going to deal with these in the short term.
How it works
To plot these graphs, I took a look at all the information that is available in the smaps file in the linux proc file system. By reverse engineering some bits and making some educated guesses, I created an extension to the m2ee monitoring graph configuration that we use to create trends. The monitoring plugin code that examines the smaps info from the linux kernel lives inside the m2ee-tools source code. The munin plugin documentation contains some hints about how you could enable this plugin yourself if you want.